| View Issue Details [ Jump to Notes ] | [ Print ] | ||||||||
| ID | Project | Category | View Status | Date Submitted | Last Update | ||||
| 0010959 | ParaView | Feature | public | 2010-07-08 14:35 | 2015-06-04 17:44 | ||||
| Reporter | Ken Moreland | ||||||||
| Assigned To | Utkarsh Ayachit | ||||||||
| Priority | normal | Severity | minor | Reproducibility | have not tried | ||||
| Status | closed | Resolution | no change required | ||||||
| Platform | OS | OS Version | |||||||
| Product Version | git-next | ||||||||
| Target Version | Fixed in Version | 4.3 | |||||||
| Summary | 0010959: Line chart should plot multiple blocks simultaneously | ||||||||
| Description | The line chart view is only able to plot series from a single block at a time. This is a very important use case for the line chart because filters like plot selection over time will place the data for each selected element in its own block. Here is a simple example of a good use case: 1. Load out can.ex2, load all variables, apply. 2. Go to the last time step. 3. Edit -> Find Data. 4. Find all cells with EQPS >= 2. 5. After the selection is run, click the "Plot Selection Over Time" button. 6. Apply the filter and observe the plot. Although many cells were selected, only one actually shows in the line chart view at a time. To view others, you have to go to the display panel and select different "blocks." This is unacceptable. You often need to compare the series against each other. | ||||||||
| Tags | No tags attached. | ||||||||
| Project | INL | ||||||||
| Topic Name | |||||||||
| Type | incorrect functionality | ||||||||
| Attached Files | |||||||||
| Relationships | ||||||
|
||||||
| Relationships |
| Notes | |
|
(0021356) Eric Monson (reporter) 2010-07-12 11:33 |
This is related to 9688: http://www.cmake.org/Bug/view.php?id=9688 [^] (Sorry, I see how to add a "related to" in the official way...) |
|
(0030539) Michał Wróbel (reporter) 2013-04-07 15:01 |
In the most recent revision of ParaView from master branch (15c678ae) the problem described by Ken can be reproduced by slightly modifying the provided steps - after step 4 one needs to click "Freeze Selection". Otherwise, only statistics of the whole set of block would be plotted and it would be plotted fine. A simpler guide to reproduce the bug is: 1. Load out can.ex2, load all variables, apply, 2. Use "Select cells on" and manually select a few cells, 3. Filters -> Data Analysis -> Plot Selection Over Time 4. Apply plot properties 5. Select a few blocks 6. Set Use Data Array again to "... Time" This will result in getting the following errors: ERROR: In /home/maw/paraview/ParaView/VTK/Charts/Core/vtkPlotPoints.cxx, line 486 vtkPlotLine (0x86ca7d0): No X column is set (index 0). As I needed this to function properly, I investigated the issue. It appears to be caused by mismatch between the name of series to use as X Axis Data ("Block: 3 ; Cell : 123/Time") and the raw variable name ("Time"). |
|
(0030540) Michał Wróbel (reporter) 2013-04-07 15:24 |
I made a simple modification which solves the issue http://review.source.kitware.com/#/t/2554/ [^] However, I feel that it's more a workaround rather than a good solution. |
|
(0034007) Utkarsh Ayachit (administrator) 2014-12-23 09:23 |
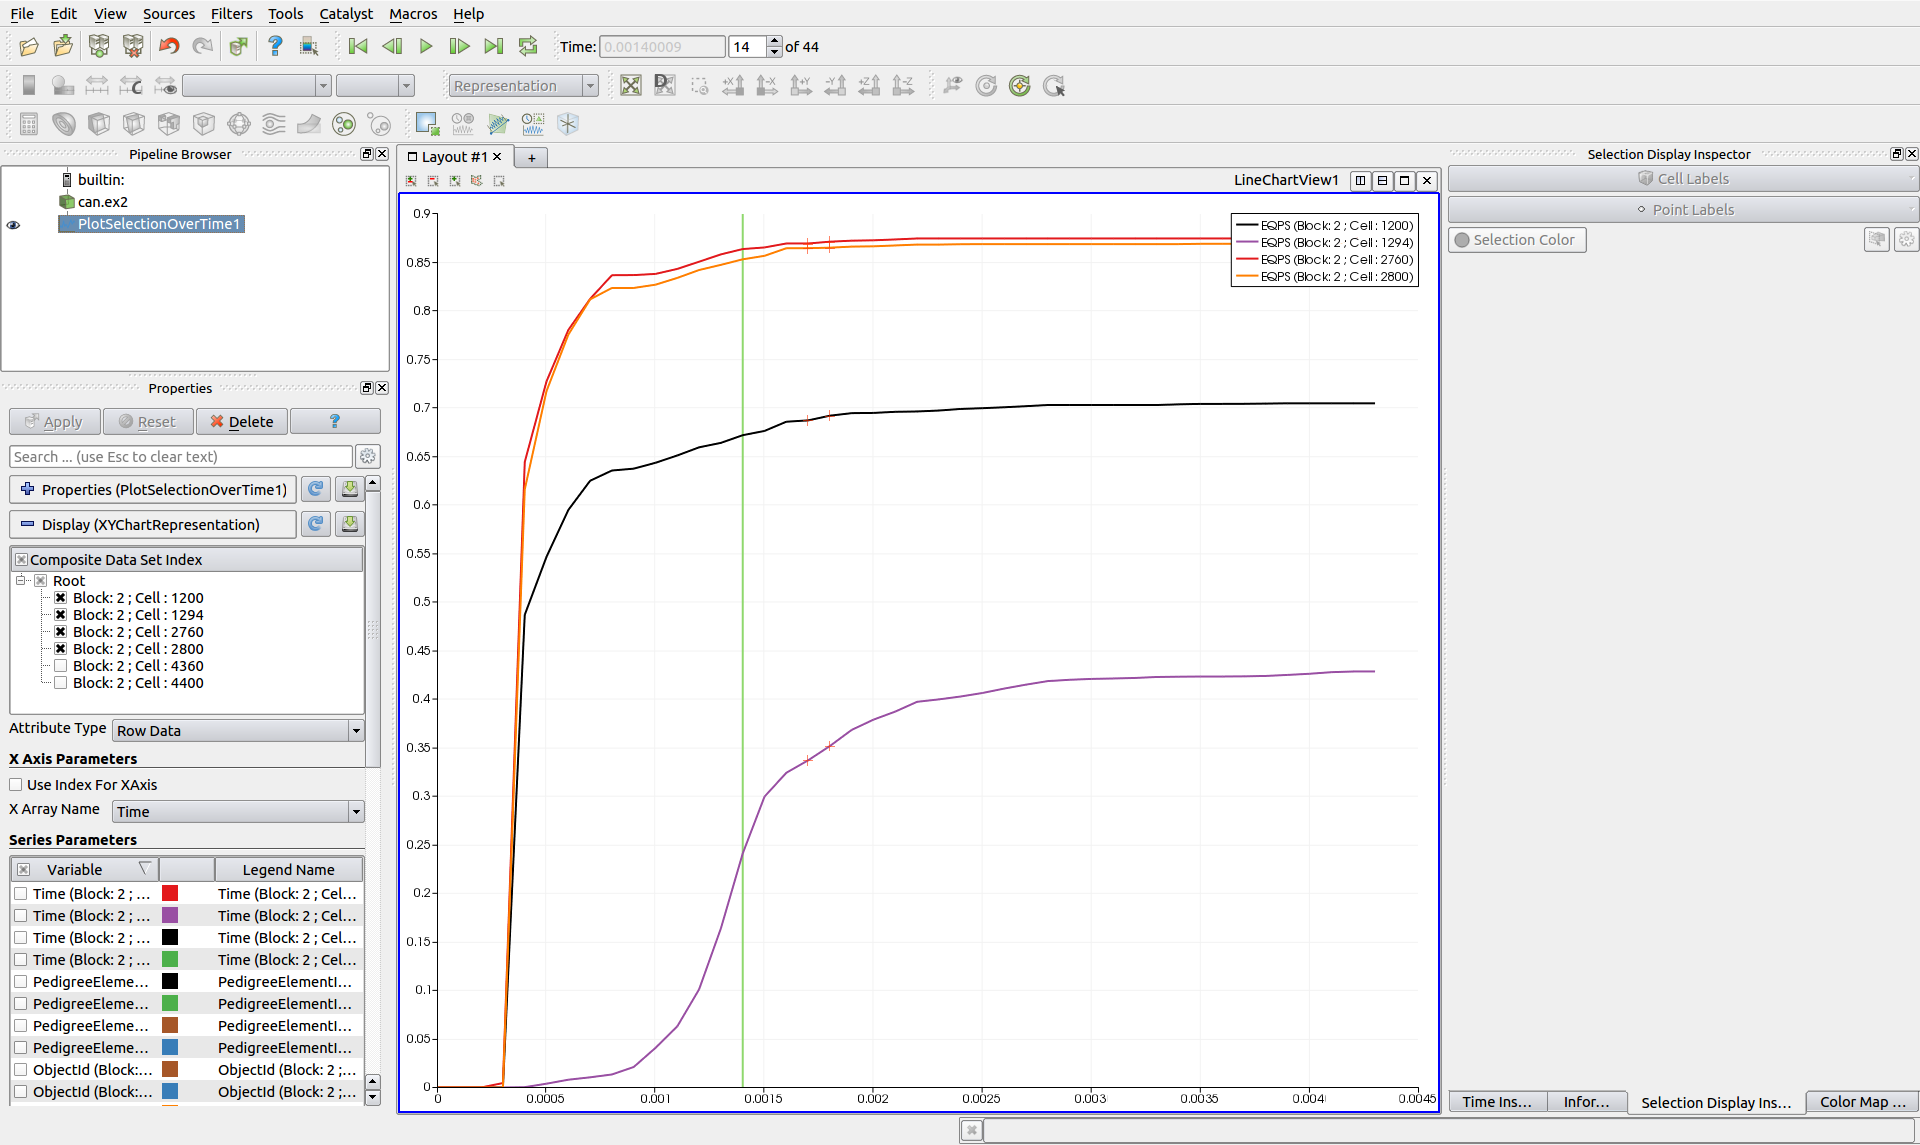
This doesn't seem to be an issue anymore. We can select multiple blocks to be shown in a line chart view without any issues (screenshot attached). Notice how line plots for multiple cells are now shown in the view. (Don't forget to "Freeze Selection" as Michal suggests, or just use his simplified steps). |
|
(0034012) Michał Wróbel (reporter) 2014-12-24 05:46 |
Yes, I confirm it has been fixed. Actually I've just found out that it has been fixed by Sebastien Jourdain a few days after my patch submission: http://www.paraview.org/Bug/view.php?id=14002 [^] http://www.paraview.org/gitweb?p=ParaView.git;a=commit;h=c87daf1d7da2d53fc88e29eee0ca10026db21acd [^] His patch actually looks like a solution, not a workaround like mine. |
|
(0034483) Alan Scott (manager) 2015-06-04 17:44 |
Oh, that is sweet. Tested master, Linux, local server. |
| Notes |
| Issue History | |||
| Date Modified | Username | Field | Change |
| 2010-07-08 14:35 | Ken Moreland | New Issue | |
| 2010-07-12 11:33 | Eric Monson | Note Added: 0021356 | |
| 2010-07-12 11:37 | Ken Moreland | Relationship added | related to 0009688 |
| 2011-06-16 13:10 | Zack Galbreath | Category | Feature Request => Feature |
| 2012-09-05 14:30 | Utkarsh Ayachit | Project | => INL |
| 2012-09-05 14:30 | Utkarsh Ayachit | Type | => incorrect functionality |
| 2012-09-05 14:30 | Utkarsh Ayachit | Assigned To | => Leo Liu |
| 2012-09-05 14:30 | Utkarsh Ayachit | Product Version | => git-next |
| 2013-04-07 15:01 | Michał Wróbel | Note Added: 0030539 | |
| 2013-04-07 15:24 | Michał Wróbel | Note Added: 0030540 | |
| 2014-12-23 09:23 | Utkarsh Ayachit | Note Added: 0034007 | |
| 2014-12-23 09:23 | Utkarsh Ayachit | Assigned To | Leo Liu => |
| 2014-12-23 09:23 | Utkarsh Ayachit | Status | expired => gatekeeper review |
| 2014-12-23 09:23 | Utkarsh Ayachit | Resolution | open => no change required |
| 2014-12-23 09:23 | Utkarsh Ayachit | Fixed in Version | => git-master |
| 2014-12-23 09:23 | Utkarsh Ayachit | File Added: Screenshot from 2014-12-23 09:22:21.png | |
| 2014-12-23 09:23 | Utkarsh Ayachit | Assigned To | => Utkarsh Ayachit |
| 2014-12-23 09:23 | Utkarsh Ayachit | Status | gatekeeper review => customer review |
| 2014-12-24 05:46 | Michał Wróbel | Note Added: 0034012 | |
| 2015-01-02 10:43 | Utkarsh Ayachit | Fixed in Version | git-master => 4.3 |
| 2015-06-04 17:44 | Alan Scott | Note Added: 0034483 | |
| 2015-06-04 17:44 | Alan Scott | Status | customer review => closed |
| Issue History |
| Copyright © 2000 - 2018 MantisBT Team |