|
Notes |
|
|
(0011286)
|
|
Ken Moreland
|
|
2008-04-14 14:10
|
|
I'm hesitant to implement this. I can think of multiple approaches, but they all have issues.
1. Divide the region between labels evenly and place tick marks there. Unfortunately, this means the value at each tick has no obvious value. This can be especially confusing if the range (or its log) is divisible by 10 but the tick marks do not line up in decimal increments.
2. Ignore labels and place ticks at regions at some decimal length. This means that the ticks will not line up with the labels and create even more confusion.
3. Adjust the labels so that fall on tick marks lined up with decimal increments. This issue with that is that the labels no longer reflect the actual range of the data (or at least the mapping), which I feel is an important cue. You could fix that by...
4. setting the top and bottom labels at the top and bottom of the range but adjusting all the mid labels to the tick marks. Ignoring the issue with the top and bottom tick marks lining up, there is still an issue with the number of labels being used. Assuming the range size is at (or close to) some multiple of 10, your choices for the number of ticks (that line up on decimals) are 2, 5, or some multiple of those. 2 is too few, you basically get a middle value and that's it. 5 is too many; the font would have to be too small to see on anything but a full screen image, and you don't even get the middle value. |
|
|
|
(0011418)
|
|
David Thompson (old)
|
|
2008-04-17 17:14
|
|
|
The attached picture has tic marks rendered in black with additional yellow marks showing the location of the text label values. The top scalar bar is logarithmic. The lower is linear. |
|
|
|
(0011475)
|
|
Ken Moreland
|
|
2008-04-22 10:18
|
|
|
Dave T. has come up with an even better solution for the tickmarks. The idea is to put the range labels above and below the bar and then scale the tickmarks such that they have nice spacing throughout the rest of the scalar bar (see the niceTics.png attachment). He has also made several algorithms to determine the appropriate spacing, written as readable MATLAB/Octave files, attached in tickmarks.tgz. There are also some plotting routines in there. |
|
|
|
(0014175)
|
|
Ken Moreland
|
|
2008-11-25 09:29
|
|
/cvsroot/ParaView3/ParaView3/Servers/Filters/vtkPVScalarBarActor.cxx,v <-- Servers/Filters/vtkPVScalarBarActor.cxx
new revision: 1.6; previous revision: 1.5
/cvsroot/ParaView3/ParaView3/Servers/Filters/vtkPVScalarBarActor.h,v <-- Servers/Filters/vtkPVScalarBarActor.h
new revision: 1.4; previous revision: 1.3
/cvsroot/ParaView3/ParaViewData/Baseline/ColorEditor1.png,v <-- ColorEditor1.png
new revision: 1.3; previous revision: 1.2
/cvsroot/ParaView3/ParaViewData/Baseline/ExtractLevel.png,v <-- ExtractLevel.png
new revision: 1.3; previous revision: 1.2
/cvsroot/ParaView3/ParaViewData/Baseline/ProxyPropertyLinks.png,v <-- ProxyPropertyLinks.png
new revision: 1.3; previous revision: 1.2 |
|
|
|
(0014296)
|
|
Alan Scott
|
|
2008-12-04 21:59
|
|
Close, but not quite.
The tick marks should follow the color of the Color Scale Editor/ Color Legend/ Labels / Color, if possible. If this is hard, the current ticks are actually a pretty good color (they show OK on a default, white or black background). |
|
|
|
(0015030)
|
|
Ken Moreland
|
|
2009-02-17 13:12
|
|
|
Tick colors now (closely) follow label colors (instead of the widget color, which nothing was using). |
|
|
|
(0015121)
|
|
Alan Scott
|
|
2009-02-17 21:48
|
|
|
Excellent. Tested local server. |
|
 ScalarBarTicMockup.png (181,461) 2008-04-17 17:12
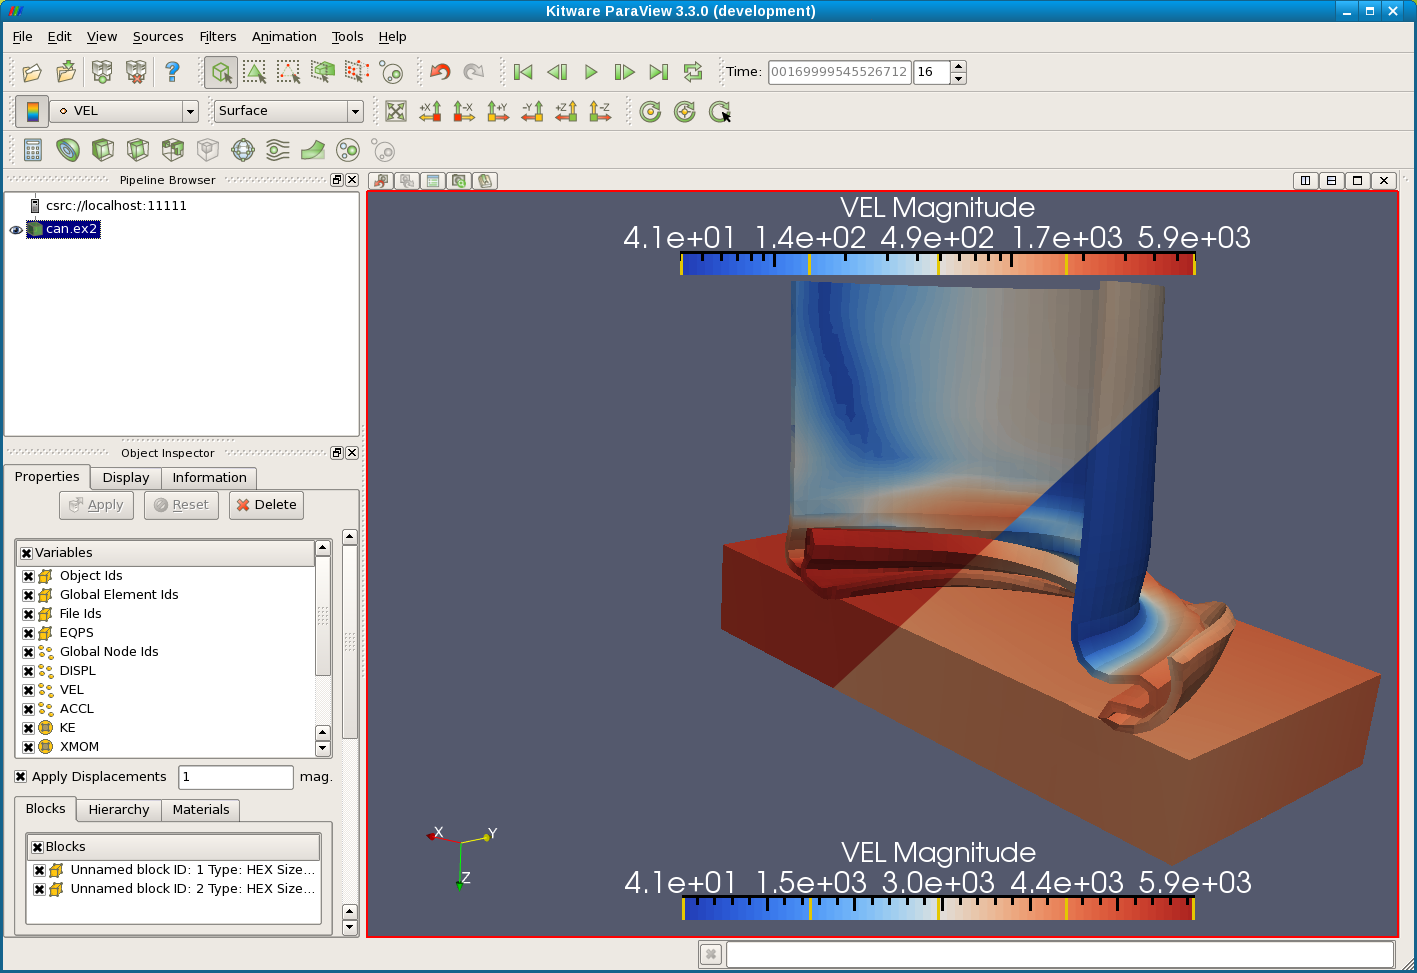

 ticmarks.tgz (1,540) 2008-04-22 10:14