Plotting Over Curves: Difference between revisions
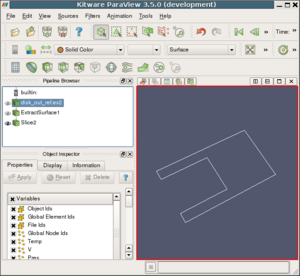
(New page: =Use Case= 300px|thumb|Figure 1: Line Loop Here's a possible use-case * Open disk_out_ref.ex2, load all variables * Apply "Extract Surface" filter to d...) |
No edit summary |
||
| Line 17: | Line 17: | ||
The algorithm can be summarized as: | The algorithm can be summarized as: | ||
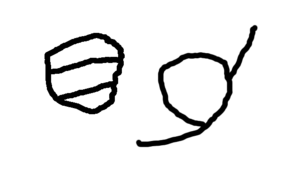
[[Image:PlotOverCurversFigure2.png|300px|thumb|Figure 2: Cases to be wary of]] | |||
* Starting with a line segment, traverse connected line segments till you come to an end. Then start traversing in the reverse direction till you reach the other end to form the poly-line. | * Starting with a line segment, traverse connected line segments till you come to an end. Then start traversing in the reverse direction till you reach the other end to form the poly-line. | ||
* If you encounter a loop, then, take the starting point as the point with min-X (or something consistent). | * If you encounter a loop, then, take the starting point as the point with min-X (or something consistent). | ||
* Beware of | * Beware of branches and branches with loops as shown in Figure 2. In such cases we want to pick longest non-overlapping segments possible. | ||
Revision as of 12:03, 13 May 2009
Use Case
Here's a possible use-case
- Open disk_out_ref.ex2, load all variables
- Apply "Extract Surface" filter to disk_out_ref
- Apply "Slice" filter to "Extract Surface"
We get a nice line loop as shown in Figure 1. Now the user wants to create a plot of the data values along this curve.
Design
Write a new filter (let's call it vtkSortLines) that takes in a vtkPolyData as input and produces a vtkMultiBlockDataSet with vtkPolyData blocks as output. Each vtkPolyData in the output multiblock is a single connected poly-line with points (vtkPoints) ordered along the length of the poly-line i.e. you can traverse the poly-line by simply going through points 0 to (N-1) in the vtkPoints data structure without having to refer to the connectivity information for the poly-line.
The output from this filter can then directly plotting in a XY Plot View.
The vtkCutter with applied to poly-data input produces line segments. The first task for this filter is to merge connected line segments into a single poly-line. Once we have the poly-line then we can create the output vtkPolyData for each poly-line with ordered vtkPoints.
The algorithm can be summarized as:
- Starting with a line segment, traverse connected line segments till you come to an end. Then start traversing in the reverse direction till you reach the other end to form the poly-line.
- If you encounter a loop, then, take the starting point as the point with min-X (or something consistent).
- Beware of branches and branches with loops as shown in Figure 2. In such cases we want to pick longest non-overlapping segments possible.

