Statistics View: Difference between revisions
No edit summary |
m (→Prototype 4) |
||
| (6 intermediate revisions by the same user not shown) | |||
| Line 9: | Line 9: | ||
Display all data in a tree view. Takes up too much vertical space and viewing more than one source/filter would require lots of vertical space. | Display all data in a tree view. Takes up too much vertical space and viewing more than one source/filter would require lots of vertical space. | ||
[[Image:Proto2.png]] | [[Image:Proto2.png]] | ||
I actually like this quite a bit. Obviously it would be a vertically oriented widget. | |||
--[[User:Bnwylie|Bnwylie]] 10:04, 19 Sep 2006 (EDT) | |||
=Prototype 3= | =Prototype 3= | ||
| Line 16: | Line 19: | ||
=Prototype 4= | =Prototype 4= | ||
No picture, but the thought is to combine the element inspector with "Prototype 3". The detailed view is organized by groups of cells/points. These groups of cells/points can come from sources/filters/selections, etc... Summary about groups of cells/points is given as ranges of scalars. Then enable drill down to get specific data values for individual cells or points. And also operations can be done on groups of cells/points or individual cells/points. Too easy for user to bring lots of heavy server side data to the client side? | No picture, but the thought is to combine the element inspector with "Prototype 3". The detailed view is organized by groups of cells/points. These groups of cells/points can come from sources/filters/selections, etc... Summary about groups of cells/points is given as ranges of scalars. Then enable drill down to get specific data values for individual cells or points. And also operations can be done on groups of cells/points or individual cells/points. Too easy for user to bring lots of heavy server side data to the client side? | ||
In general I like the idea of a 'heavy duty' drilldown capability. I think having something light like Prototype 2, and then have some uber interface that has total drilldown into every possible bit of info that someone might want to know. An example is the SpyInspect program (note old screen shot and I'm not claiming good design... :) | |||
[[Image:spyInspectScreenShot.JPG]] | |||
<br>[[User:Bnwylie|Bnwylie]] 10:21, 19 Sep 2006 (EDT) | |||
Latest revision as of 09:22, 19 September 2006
Overview
Some prototypes of an enhanced statistics view to include array data information.
Prototype 1
Embed a table inside our spreadsheet which can be expanded and collapsed by clicking on the plus/minus. Data fits without taking up too much space, at the expense of disassociating the columns with some data. This would require custom coding of the view.

Prototype 2
Display all data in a tree view. Takes up too much vertical space and viewing more than one source/filter would require lots of vertical space.

I actually like this quite a bit. Obviously it would be a vertically oriented widget. --Bnwylie 10:04, 19 Sep 2006 (EDT)
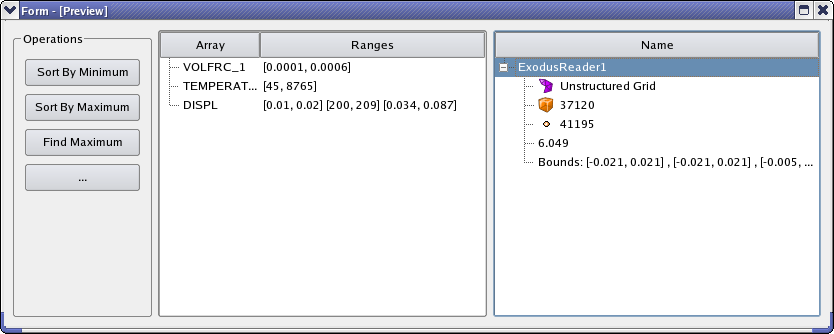
Prototype 3
Provide tree view of information and provide a table for detailed information. User from tree into table to get more information about items. Operations can be provided to operate on the table.

Prototype 4
No picture, but the thought is to combine the element inspector with "Prototype 3". The detailed view is organized by groups of cells/points. These groups of cells/points can come from sources/filters/selections, etc... Summary about groups of cells/points is given as ranges of scalars. Then enable drill down to get specific data values for individual cells or points. And also operations can be done on groups of cells/points or individual cells/points. Too easy for user to bring lots of heavy server side data to the client side?
In general I like the idea of a 'heavy duty' drilldown capability. I think having something light like Prototype 2, and then have some uber interface that has total drilldown into every possible bit of info that someone might want to know. An example is the SpyInspect program (note old screen shot and I'm not claiming good design... :)

Bnwylie 10:21, 19 Sep 2006 (EDT)