Default Color Map: Difference between revisions
No edit summary |
|||
| Line 49: | Line 49: | ||
== Table of Color Maps == | == Table of Color Maps == | ||
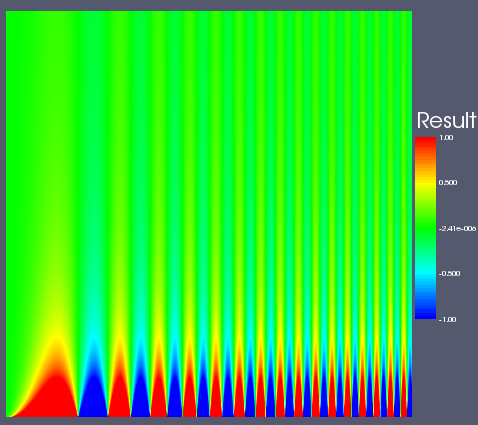
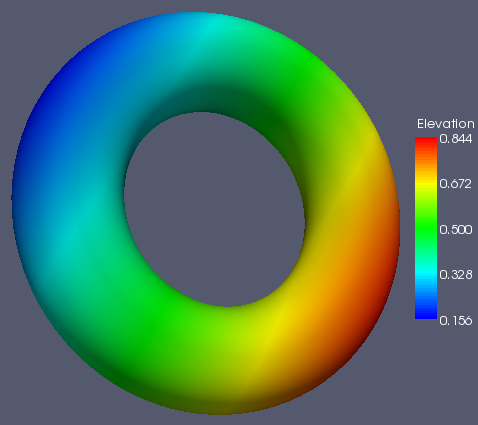
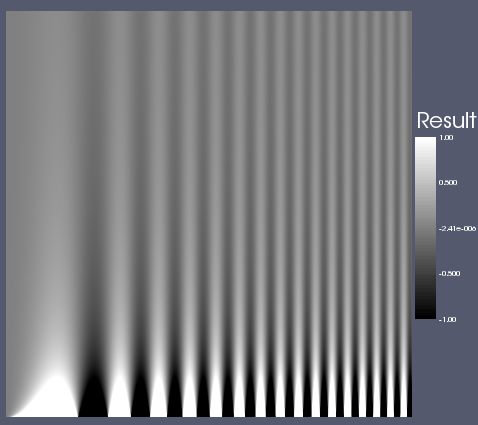
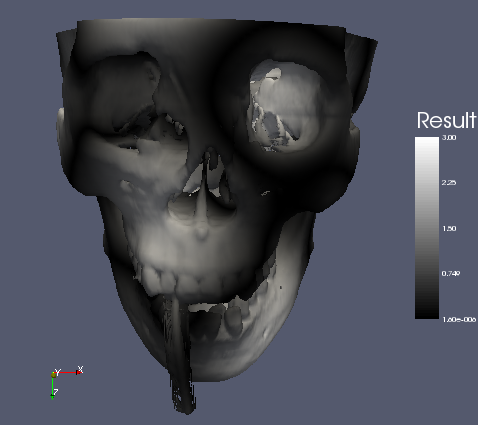
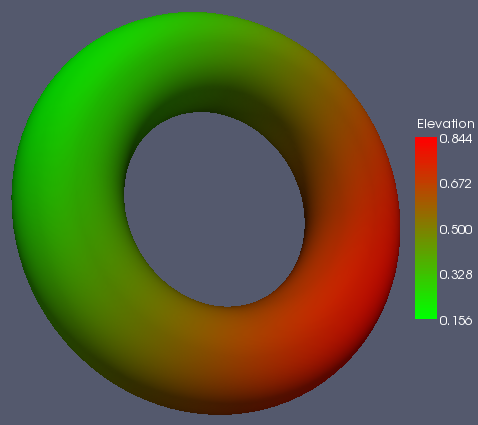
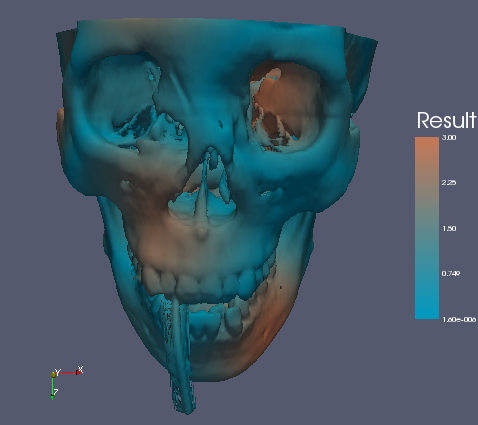
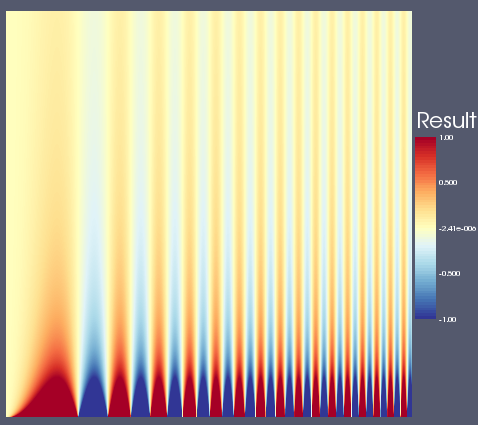
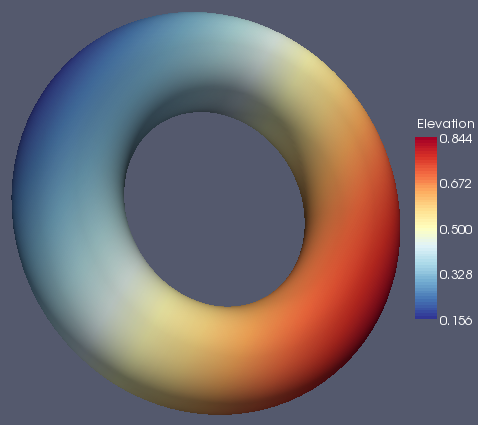
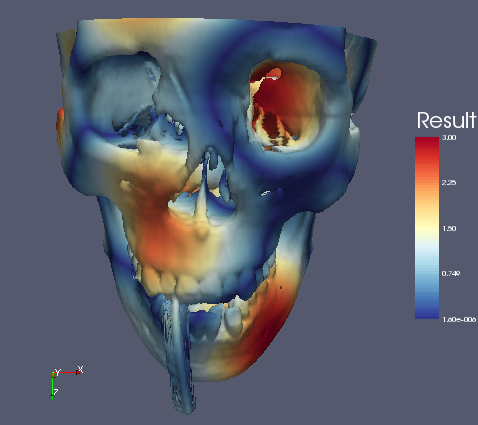
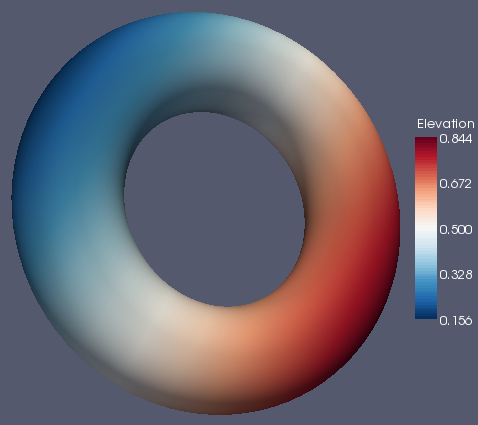
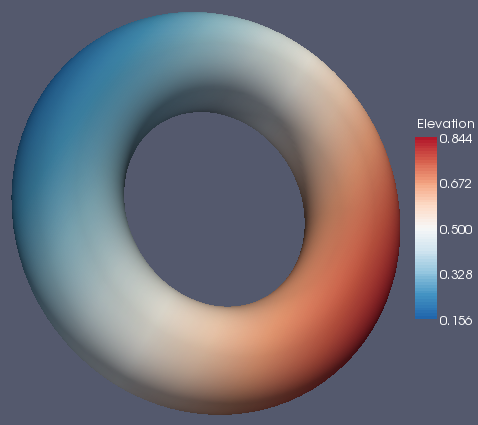
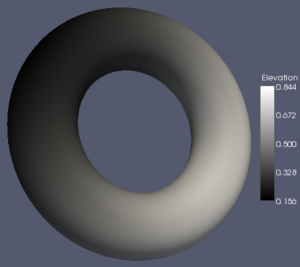
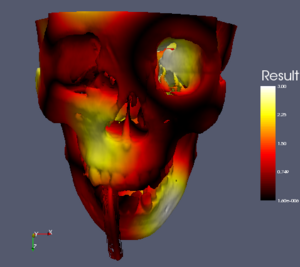
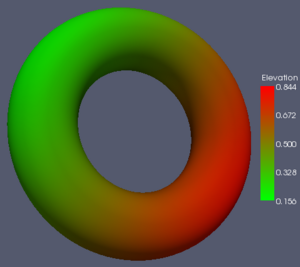
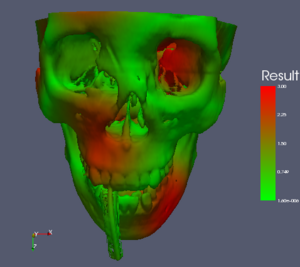
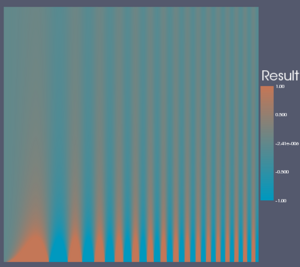
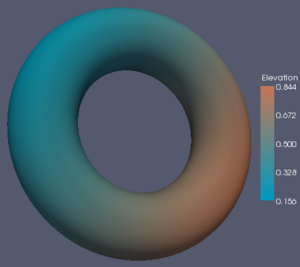
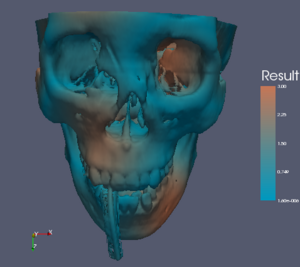
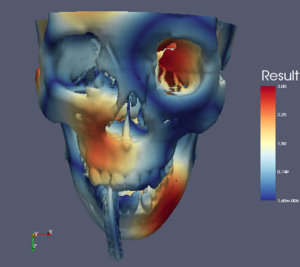
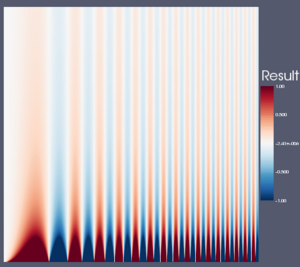
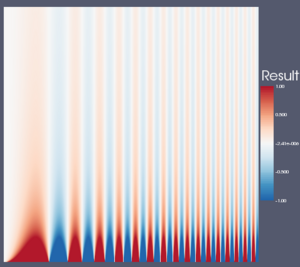
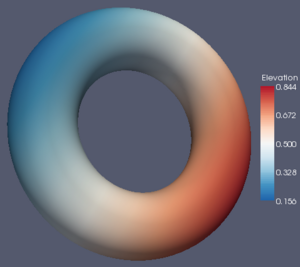
For reference and comparison, here is a table comparing all the color maps with three different data sets. From left to right, the data sets are: a spatial contrast sensitivity function, a torus with an elevation field, and a skull with a distracting scalar field. From top to bottom, the color maps are: rainbow, grayscale, black-body radiation, isoluminant red-green, isoluminant CIE lab, and three maps derived from the [www.colorbrewer.org ColorBrewer]. | For reference and comparison, here is a table comparing all the color maps with three different data sets. From left to right, the data sets are: a spatial contrast sensitivity function, a torus with an elevation field, and a skull with a distracting scalar field. From top to bottom, the color maps are: rainbow, grayscale, black-body radiation, isoluminant red-green, isoluminant CIE lab, and three maps derived from the [http://www.colorbrewer.org ColorBrewer]. | ||
{| | {| | ||
Revision as of 08:20, 30 May 2007
While at lunch recently I was flipping through a recent edition of IEEE Computer Graphics and Applications and came across the following article by David Borland and Russell M. Taylor II: "Rainbow Color Map (Still) Considered Harmful." The article iterates over all the well known ways that the rainbow color map fouls up visualization. What really caught my eye, though, was that ParaView was specifically mentioned.
Inspection or documentation indicated that ParaView, Matlab, VisAD, Ensight, Iris Explorer, and AVS Express all use the rainbow color map by default. Supplied tutorials indicated that SCIRun and OpenDX use the rainbow color map by default. Amira is the only program reviewed that does not use the rainbow color map by default.
It is a little bit embarrassing to be pointed out in a national article as a bad example for visualization. Still, we are also lumped into the same category as Ensight, AVS, and SCIRun (and VisIt was never even mentioned). Nonetheless, as a world leader in visualization it would be nice to do something better or, if we can't, have a pretty good reason why not. Thus, I started my quest to find that elusive "best" color map.
Rainbow Color Map
Grayscale and Black-Body Radiation Color Maps
Isoluminant Color Maps
Brewer Color Maps
Table of Color Maps
For reference and comparison, here is a table comparing all the color maps with three different data sets. From left to right, the data sets are: a spatial contrast sensitivity function, a torus with an elevation field, and a skull with a distracting scalar field. From top to bottom, the color maps are: rainbow, grayscale, black-body radiation, isoluminant red-green, isoluminant CIE lab, and three maps derived from the ColorBrewer.

|

|

|

|
|

|

|

|
|

|
|
|
|
|
|

|

|
|
|

|

|
|
|

|
