Plotting Over Curves: Difference between revisions
(Add the documentation of Plot Edges filter) |
|||
| Line 38: | Line 38: | ||
=Technical details= | =Technical details= | ||
The <b>Plot Edges</b> filter | The <b>Plot Edges</b> filter accepts 2 types of inputs: a [http://www.vtk.org/doc/nightly/html/classvtkPolyData.html vtkPolyData] or a [http://www.vtk.org/doc/nightly/html/classvtkMultiBlockDataSet.html vtkMultiBlockDataSet] containing one or more vtkPolyData.<br> | ||
The output generates a [http://www.vtk.org/doc/nightly/html/classvtkMultiBlockDataSet.html vtkMultiBlockDataSet] with a [http://www.vtk.org/doc/nightly/html/classvtkPolyData.html vtkPolyData] leaf for each polyline.<br> | The output generates a [http://www.vtk.org/doc/nightly/html/classvtkMultiBlockDataSet.html vtkMultiBlockDataSet] with a [http://www.vtk.org/doc/nightly/html/classvtkPolyData.html vtkPolyData] leaf for each polyline.<br> | ||
Revision as of 12:39, 28 May 2009
Presentation
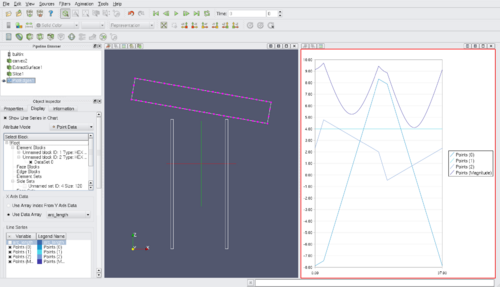
The Plot Edges filter sort and order polylines for graph visualization. The filter split and merge any set of polylines to generate a more coherent set of point-ordered smoothed polylines. The points and cells of the output polylines are ordered in order to have an easy to read graph visualization of the point attributes.
- Ordering
If an input polyline has a set of points like 1,3,5,7,...29,31,30,28...4,2,0, jumps would occurs in the graph. This is why the filter sorts the points along the lines.
- Branching
The previous example was trivial, the input polydata was simple polylines with no branching. In some other cases, input polydata contains loops and branches. The Plot Edges filter tries to overcome the problem by merging the best branches together. It infers that a polyline is smooth and regular: no abrupt change in direction and points spacing is homogeneous. For each nodes in the polydata, a score is computed between the node's polylines. The polylines that make the best pair (highest score) are merged together.
- Limitations
The branch merging algorithm may not be optimum for all the cases. Sometimes the choice of merging would require more high-level information.
Suggestion: different merging algorithms can be designed, the user could choose what algorithm would process the best his data...
How to use
The Plot Edge filter can only be connected to 2D lines. The typical workflow would be:
- Apply the Extract Surface filter to the object
- Apply the Slice filter (plane cut) to Extract Surface.
- Apply the Plot Edges filter to Slice.
- In the Plot Edges Display tab, check the Variable check boxes to visualize the point attributes on the graph.
- in the 3D view, to colorize the polylines with the arc length values, turn the Plot Edges visiblity on and set the Color by box to "arc_length".
For convenience, a composite filter Plot Edges by Plane intersect has been created to automatically apply the filters Extract Surface, Slice and Plot Edges.
Technical details
The Plot Edges filter accepts 2 types of inputs: a vtkPolyData or a vtkMultiBlockDataSet containing one or more vtkPolyData.
The output generates a vtkMultiBlockDataSet with a vtkPolyData leaf for each polyline.


