Full visualization and analysis pipelines can be scripted and run without relying on the ParaView desktop application. ParaView provides Python scripting modules that cover all of the capabilities of the ParaView desktop application. This capability is useful in several contexts.
Automate your analysis
ParaView’s Python scripting layer is useful when the interactive exploration phase is over, and you are ready to apply analysis and visualization pipelines to large datasets. Scripting lets you easily streamline repetitive jobs, handle intensive tasks without interaction, and create dedicated solutions for their needs. This is especially useful in batch processing so you can extract meaningful information from large simulations, either in situ or post-processing. Scripts even work in client/server mode and on servers running on thousands of processors. They can also be invoked as part of in situ analysis while a simulation is running using Catalyst.
If you can script it, you can visualize it on the web!
Python scripts for ParaView form a basic building block of custom web-enabled visualization applications using platforms like ParaViewWeb and trame. You can leverage scripting in ParaView to quickly develop more tailored solutions through the Web or as standalone applications.
Customize data processing
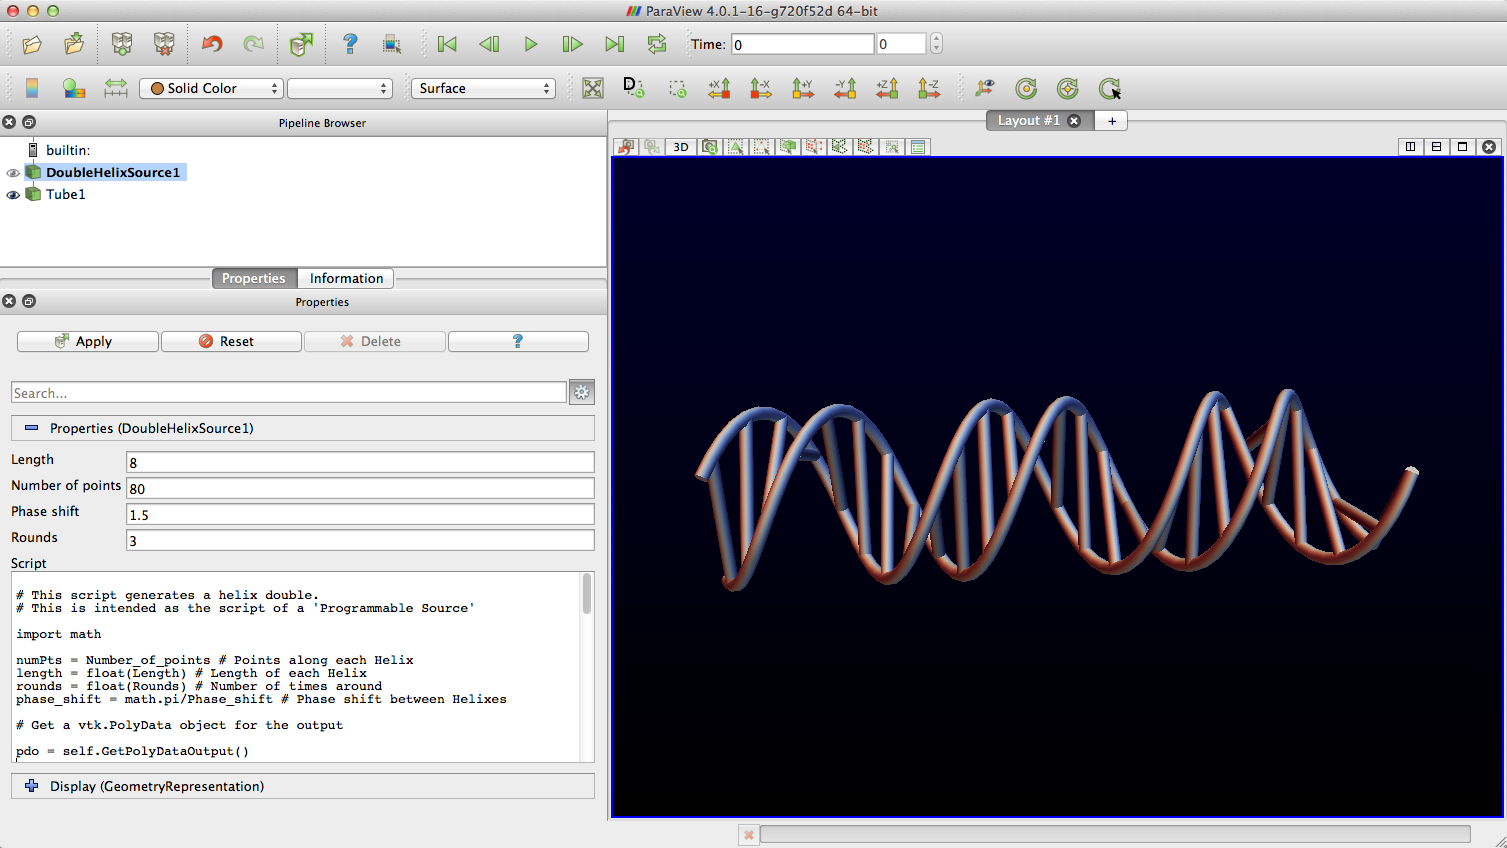
In addition to scripting ParaView visualization pipelines, ParaView provides several ways to enhance its capabilities. Programmable data sources and filters provide low-level access to data and enable you to perform custom data filtering operations not already available in ParaView.
Get started writing ParaView Python scripts
The ParaView Guide has examples of Python scripting throughout. ParaView can write the Python script for you using the Python Tracing feature, which records actions in the ParaView desktop application as Python code.
Professional ParaView Support
Scripting provides access to powerful visualization and data analysis tools in ParaView and encourages data exploration. For general instructions, tutorials, and webinars, visit the Resources page. If you are looking for more customized support for ParaView, please reach out for more information.