| View Issue Details [ Jump to Notes ] | [ Print ] | ||||||||
| ID | Project | Category | View Status | Date Submitted | Last Update | ||||
| 0014886 | ParaView | (No Category) | public | 2014-07-24 19:51 | 2016-08-12 09:59 | ||||
| Reporter | Ken Moreland | ||||||||
| Assigned To | Kitware Robot | ||||||||
| Priority | high | Severity | minor | Reproducibility | have not tried | ||||
| Status | closed | Resolution | moved | ||||||
| Platform | OS | OS Version | |||||||
| Product Version | git-master | ||||||||
| Target Version | 5.1 | Fixed in Version | |||||||
| Summary | 0014886: Descriptive statistics max appears wrong | ||||||||
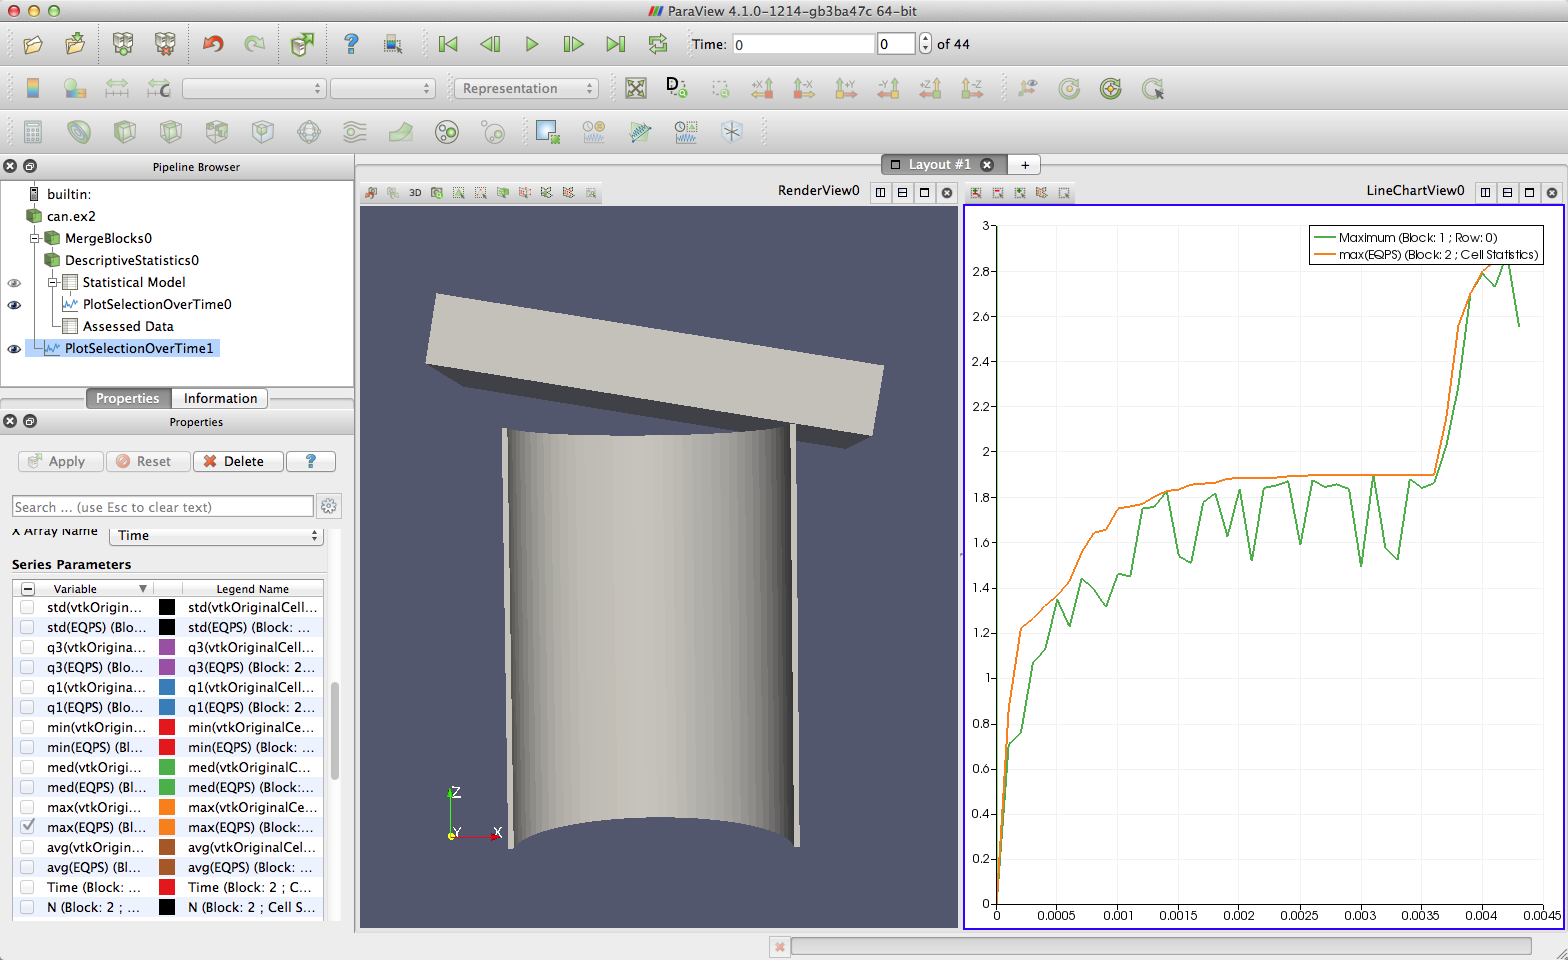
| Description | The descriptive statistics filter seems to be providing the wrong value for maximum, at least when it is used in conjunction with plot selection over time. To replicate, do the following: 1. Load can.ex2. Turn on EQPS. Apply. 2. Merge blocks. Apply. 3. Add Descriptive Statistics filter. Change attribute mode to Cell Data. Select EQPS variable (only). Apply. 4. In the spreadsheet of the statistical model, select the row associated with EQPS. (If you only selected the EQPS previously, it should be the only row.) 5. Add the Plot Selection Over Time Filter. Apply. 6. Delete the spreadsheet views (to see the plot more easily). Select only the Maximum series. Notice the weird sawtooth nature of the plot. That is not right. It should be mostly (if not totally) monotonically increasing. 7. Select the Merge Blocks filter in the pipeline browser. 8. Open Find Data. Query for the max EQPS. Plot selection over time. Apply. 9. In this plot, select only the maximum EQPS value. This curve shape is expected. I've attached an image of the results. The two versions of maximum should give the same value. Considering how weird the curve from descriptive statistics looks, I believe that is the one that is incorrect. | ||||||||
| Tags | No tags attached. | ||||||||
| Project | Sandia | ||||||||
| Topic Name | |||||||||
| Type | incorrect functionality | ||||||||
| Attached Files |  | ||||||||
| Relationships | |
| Relationships |
| Notes | |
|
(0033081) Alan Scott (manager) 2014-07-24 20:37 |
This is misrepresenting data, thus I am targeting it for 4.3. |
|
(0033096) David Thompson (developer) 2014-07-25 19:51 |
Since no one mentions adjusting the default parameters of the Descriptive Statistics filter, I assume this is caused by training the model using only half of the dataset (the default). This was chosen so that people would evaluate statistical models using the remainder of the dataset rather than blindly supposing the data fit the assumptions of the model. If people are using the filter differently, then either 1. the filter should be modified so that a minimum sample size is enforced (at least 100,000 samples) or 2. the default mode of operation should be changed. Please do not just change the default training set fraction to be 1.0. |
|
(0033106) Ken Moreland (manager) 2014-07-27 17:47 |
That's a good assumption. I suspect most people are using the descriptive statics filter simply to get the model information (average, min, max, stddev). In fact, I would venture to say that most users don't even know how to use the model to evaluate (myself included). I would suggest changing the default behavior to base the model on all values. Although sampling should give you a reasonable value for average and standard deviation, it's highly likely to fail to get reasonable values for min and max. Min and max are just wrong (statistically or otherwise). |
|
(0036057) Cory Quammen (developer) 2016-06-10 10:55 |
If you want the min and max for the entire data set, you can change the "Task" option to "Detailed model of input data". The documentation for this in the filter is fairly clear. We could change the default Task type to this if you would like. |
|
(0038607) Kitware Robot (administrator) 2016-08-12 09:59 |
Resolving issue as `moved`. This issue tracker is no longer used. Further discussion of this issue may take place in the current ParaView Issues page linked in the banner at the top of this page. |
| Notes |
| Issue History | |||
| Date Modified | Username | Field | Change |
| 2014-07-24 19:51 | Ken Moreland | New Issue | |
| 2014-07-24 19:51 | Ken Moreland | File Added: ParaView002.png | |
| 2014-07-24 20:37 | Alan Scott | Project | TBD => Sandia |
| 2014-07-24 20:37 | Alan Scott | Note Added: 0033081 | |
| 2014-07-24 20:37 | Alan Scott | Priority | normal => high |
| 2014-07-24 20:37 | Alan Scott | Target Version | => 4.3 |
| 2014-07-25 19:51 | David Thompson | Note Added: 0033096 | |
| 2014-07-27 17:47 | Ken Moreland | Note Added: 0033106 | |
| 2014-11-14 22:52 | Utkarsh Ayachit | Target Version | 4.3 => 4.4 |
| 2015-09-11 16:43 | Utkarsh Ayachit | Target Version | 4.4 => 5.1 |
| 2016-06-10 10:55 | Cory Quammen | Note Added: 0036057 | |
| 2016-08-12 09:59 | Kitware Robot | Note Added: 0038607 | |
| 2016-08-12 09:59 | Kitware Robot | Status | backlog => closed |
| 2016-08-12 09:59 | Kitware Robot | Resolution | open => moved |
| 2016-08-12 09:59 | Kitware Robot | Assigned To | => Kitware Robot |
| Issue History |
| Copyright © 2000 - 2018 MantisBT Team |