Chart Art
From ParaQ Wiki
Jump to navigationJump to search
Chart Features
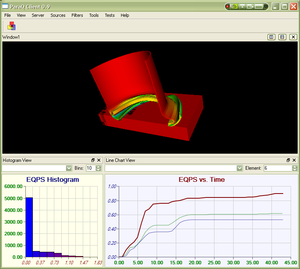
A demo of all of the independently-controllable chart style features, many existing, some new:
|
|||
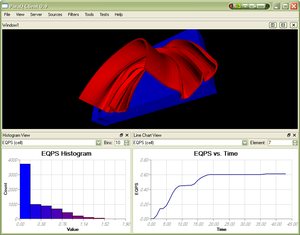
| The less-obnoxious version, plus axis labels, both horizontal and vertical. | |||
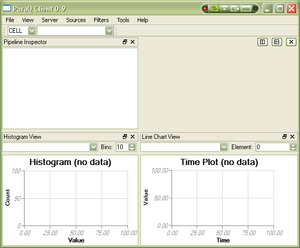
| Default charts that are displayed whenever there isn't any data (or it's the wrong type). | |||
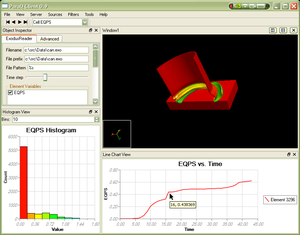
| Demos "chart tips", informational tooltips that are associated with chart elements (in this case, lines in the line plot). | |||
| Media:Histogram.pdf | The histogram and line charts can be exported to high-quality PDF, and/or printed. | ||
|
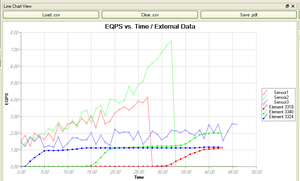
Line charts can display plots with markers. A variety of marker styles are provided, including crosses, plus-symbols, filled- and unfilled-circles, filled- and unfilled squares. Marker style (colors, line-weight, line-styles, interior color, etc) can be independently controlled. New marker styles can easily be created by deriving from pqMarkerPen. |
