Dobran-O-Viz Documentation
Overview
Dobran-O-Viz serves as a sample application demonstrating how custom applications can be built on the ParaQ framework.
Using Dobran-O-Viz, you can plot experimental data (loaded from an external CSV file), corresponding experimental uncertainty (also an external CSV file), corresponding simulation data (loaded from an Exodus file), corresponding simulation uncertainty (another external CSV file), and the simulation error, with aggregated uncertainty. Plots may incorporate optional "reference images" for easy identification.
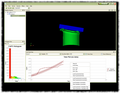
Dobran-O-Viz displaying experimental and simulation plots.
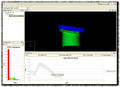
Dobran-O-Viz displaying the simulation error, including uncertainty quantification.


Experimental Data
Experimental data is stored in a CSV file. The file contains one column for timestamps, followed by one-to-many columns of data. Each data column represents an experimental "sensor". The first cell in the timestamp column must be the text "Time". The first cell in each data column should be a text label that uniquely identifies the experimental sensor.
Sample File
Note that this sample includes data for two sensors:
| Time | Sensor 1 | Sensor 2 |
| 1 | 2.1 | 2.1 |
| 2 | 2.2 | 2.4 |
| 3 | 2.3 | 2.6 |
Experimental Uncertainty
Experimental uncertainty is (optionally) stored in a CSV file. The file contains one column for timestamps, followed by an even number of data columns. Each pair of data columns represents the upper- and lower-bounds of certainty (in that order) for an experimental data sensor. The first cell in the timestamp column must be the text "Time". The first cell in each pair of data columns should be a text label that matches the label for a data column in the experimental data file. The labels for each pair of uncertainty columns must match.
Sample File
Note that in this sample, uncertainty is only provided for "Sensor1", the upper and lower bounds, respectively. Also note that upper and lower bounds are both positive numbers.
| Time | Sensor 1 | Sensor 1 |
| 1 | 0.1 | 0.1 |
| 2 | 0.12 | 0.15 |
| 3 | 0.14 | 0.2 |
Simulation Uncertainty
Simulation uncertainty is (optionally) stored in a CSV file. The file contains one column for timestamps, followed by an even number of data columns. Each pair of data columns represents the upper- and lower-bounds of certainty (in that order) for an element in the simulation data. The first cell in the timestamp column must be the text "Time". The first cell in each pair of data columns should be a text label that matches an element ID from the simulation data. The labels for each pair of uncertainty columns must match.
Sample File
Note that in this sample, uncertainty is only provided for single simulation element, "18874". The second and third columns are the upper and lower bounds, respectively. Also note that upper and lower bounds are both positive numbers.
| Time | 18874 | 18874 |
| 1 | 0.05 | 0.04 |
| 2 | 0.12 | 0.16 |
| 3 | 0.19 | 0.30 |
Experimental / Simulation Map
The experimental / simulation map file maps experimental data to simulation elements, and (optionally) associates a reference image with the experimental data. It is a CSV file that contains one column for experimental data set labels, one column for simulation element IDs, and one column for (optional) reference images. The first cell in each column must be "Experimental Data", "Simulation Element", and "Reference Image", respectively.
Sample File
| Experimental Data | Simulation Element | Reference Image |
| Sensor 1 | 18874 | |
| Sensor 2 | 1273 | assembly13.jpg |
Note that reference image paths may be absolute or relative. If relative, they will be relative to the location of the mapping-file.
Setup File
All of the above files can be loaded individually, but an XML setup file can be created to reduce repetition:
<setup>
  <experimental>experimental_data2.csv</experimental>
  <experimental_uncertainty>experimental_uncertainty2.csv</experimental_uncertainty>
  <simulation_uncertainty>simulation_uncertainty2.csv</simulation_uncertainty>
  <experiment_simulation_map>experiment_simulation_map2.csv</experiment_simulation_map>
</setup>
Note that the setup file can contain zero-to-many instances of each file type, in any order.
File paths may be relative or absolute. Relative paths should be relative with-respect-to the path to the session file, i.e. if the above session file was located at /home/tshead/dobranoviz/session1.xml, the experimental data should be located at /home/tshead/dobranoviz/experimental_data2.csv.
Notes
The contents of the data files are constrained as follows:
- The number rows in the experimental data and experimental uncertainty files must match.
- The number of rows in the simulation uncertainty file and the number of timesteps in the simulation data must match.
- The units-of-time for the experimental and simulation data must match.
- The units-of-measure for the experimental and simulation data must match.
- Timesteps for experimental and simulation data do not have to match - when plotting simulation error, linear interpolation is used to match simulation data to experimental data. Only "overlapping" ranges of simulation and experimental data will be plotted.