It's views all the way down

Well, we've said it before, but it's time to address the question of what is a view. We've said that 'it's views all the way down' ... meaning that everything that is not a toolbar or a draggable window is a view. Plots are views. QVTKWidgets are views. And on and on.
Along these lines, there's been some thinking about what this abstraction means, in conjunction with:
- What it means to save all state on the server.
- How the specific case of client-side graphing fits in with a general client/server model. In particular, how to we justify client-side rendering of plots, when everything else is done on the server side?
- Advanced UI customization - some of which is pie-in-the-sky, but which relates very strongly to the design we need for client-side graphing.
So, here are a few diagrams that resulted from some expansive thinking in these areas.
Graphs
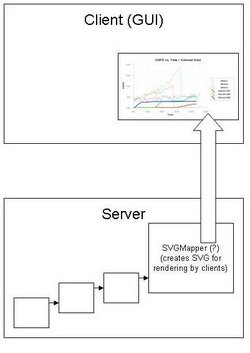
The basic idea is to let the server control the 'layout' of data, but leave the rendering up to the client. For example, data from a filter could be 'mapped' into a plot, and the plot could be 'rendered' into XML for delivery to the client. The client would then render the XML.
Figure 1 shows how this might work for a specific type of XML. The figure is a diagram of a server-side Mapper or some other ParaView-like object that creates SVG (Scalable Vector Graphics) of a graph. This SVG is then delivered to the client for rendering. The advantage of this is that the properties that control the appearance of the graph will be stored on the server side, which follows the current design. (The client would be responsible for providing UI elements that control these attributes)
Active 'Pages'
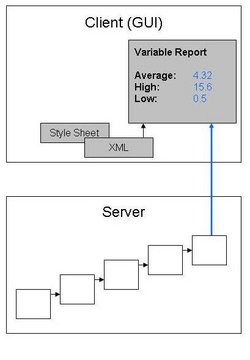
A similar type of thing could be done with XML, Style Sheets and attributes. Imagine the user wanted to create a table of values - to compare values from different datasets, for example. The user could edit an XML file, which, in conjunction with a style sheet, could display these values in a client-side html renderer. This would be a very flexible way for users to create reports, controls, or other custom UI elements.
