It's views all the way down
From ParaQ Wiki
Jump to navigationJump to search

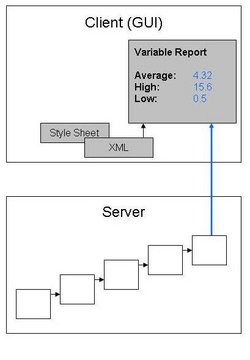
Figure2: Client/Server diagram showing a client-side view incorporating XML, a Style Sheet, and attributes from a server object. The combination of these elements, when rendered by the client, create a dynamically-updating 'report' or page. The XML can be edited by the user, allowing the user to change the layout, or to change the attributes that are shown. Note that the attributes could be from any filter on the server-side graph.
Well, we've said it before, but it's time to address the question of what is a view.
Graphs
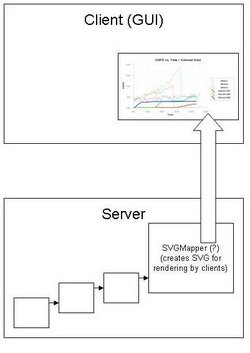
FIgure 1 shows a diagram of a server-side Mapper or some other ParaView-like object that is responsible for creating SVG (| Scalable Vector Graphics) of a graph. This SVG is then delivered to the client for rendering.
